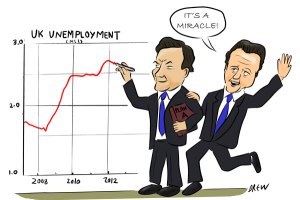
One of the purported achievements of the Coalition government’s disastrous economic policy of austerity, has been the unemployment figures. Pundits say that at 7.8% (2.51m) they are nothing to shout about but not the disastrous rates seen in states such as Greece (26.9%) or Spain (26.3%). In reality, the unemployment rate is more than double this in many areas, while those in employment are facing ever worsening conditions to retain their non-jobs.
Messing with the Figures

We have the Thatcher government to thank for the majority of the statistical trickery which currently renders the government released unemployment figures redundant. Prior to 1979, the unemployment rate was anyone registered as unemployed, this was converted to a percentage of the total workforce and that was the published unemployment rate. Then some changes came in:
- Redefining Unemployment: originally defined as those ‘registered’ unemployed, changed to only count ‘claimants’ – this obviously reduced the number greatly as many unemployed people do not, for various reasons, claim benefits.
- Cutting Benefit Entitlements: By making changes to the benefit system (who is eligible and not) the government can magic away unemployment numbers by simply removing eligibility for benefits. If the person cannot claim, they are not classed as unemployed.
- Training Schemes & Work Programmes: the conservative government of the 80’s began to double count those in training & work programmes. First, they excluded them from the unemployed figures, then they added them to the total workforce figures – this means that simply by recruiting people into a work programme, the government has reduced the unemployment figures. Prior to Thatcher, these schemes were not counted as employment.
Sadly, none of these changes have since been reversed, giving the UK public a much skewed view of unemployment and underemployment. If we look at the research prepared by other bodies without such downright deceitful exemptions, we reveal a more realistic picture of the economic woe being meted out across the country.
The Real Unemployment Rate
A study put together by Sheffield University last year set out to establish the real level of unemployment in the UK, given that there has been little change in the published unemployment statistic, we can suppose they still hold relatively true. The study found:
- For Britain as a whole in April 2012, the new figures point to more than 3.4 million unemployed. This compares to just 1.5 million on the claimant count and 2.5 million according to the Labour Force Survey – the government’s two official measures of unemployment. The difference is attributable to extensive hidden unemployment.
- An estimated 900,000 unemployed have been diverted onto incapacity benefits. These are men and women with health problems who claim incapacity benefits instead of unemployment benefits. They do not represent fraudulent claims.
- Hidden unemployment is disproportionately concentrated in the weakest local economies, where claimant unemployment is already highest. The effect has been to mask the true scale of labour market disparities between the best and worst parts of the country.
- In the worst affected districts, the real rate of unemployment is often around 15 per cent. Knowsley in Merseyside tops the list with a real rate of unemployment estimated at 16.8 per cent.
- The older industrial areas of the Midlands, the North, Scotland and Wales mostly have the highest rates of unemployment. In large parts of the south of England the rate is still only 3-4 per cent.
- Comparisons with similar data for earlier years shows that Britain was still a long way off full employment before the 2008/9 recession. Full employment is now still further away and the real rate of unemployment is higher than at any time since 1997.
- The report casts serious doubt on the likely impact of the Coalition government’s reforms, notably the Work Programme and Universal Credit, which are founded on the assumption that unemployment can be brought down by encouraging the unemployed to find work. The evidence points to large and continuing shortfalls in job opportunities away from the most prosperous parts of southern England.
Exploiting the Unemployment Racket

The government is pressurising people into ever more exploitative work programmes in order to reduce unemployment figures by threatening withdrawal of social security for non-compliance. In 2011, the Conservative and Liberal Democrat coalition government announced a plan to increase uptake of Workfare (the term given to these schemes) by 100,000. They also made changes to the programme they inherited from New Labour as follows:
1. A jobseeker who leaves a placement after 1 week loses their welfare payments for 6 weeks. If they do this a second time, they lose them for 13 weeks. The third time, three years.
2. Placements can be mandated for up to 30 hours a week for as long as 6 months.
3. The scheme has been opened up so corporations in the private sector can exploit this taxpayer funded, forced labour.
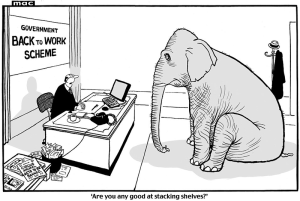
This means that someone who finds themselves unemployed must work up to thirty hours a week, for up to six months at a time, stacking shelves for Tesco or Poundland simply to receive as little as £53 per week, which they are already entitled to as part of the social contract of Britain. Also, Tesco isn’t paying the £53; we are, through our taxes.
Although an interview is supposed to be guaranteed at the end of the term, it is not required that the workfare provider has a vacancy open. An interview for a job that doesn’t exist is no interview at all.
Corporations get free labour, the government gets to massage the unemployment figures (Workfare victims are counted as employed) and the unemployed get shafted.
Anyone doubting this critique would do well to read the findings of the DWP’s own analysis of the performance of their work programmes. These schemes cost the taxpayer £5bn, yet only 1 in 10 people found employment lasting up to 3 months. The figures are even worse for the sick and disabled people forced into the work programmes – only 1 in 20 finding lasting employment.
The picture doesn’t get any rosier for those who have managed to find employment either.
Employers are less likely to provide real jobs than ever. As the market favours the employer, there has been an unprecedented month on month fall in wages through the entire 36 months of the Coalition government, and wages were already falling before they arrived.
On top of hidden unemployment, the UK also has an ever growing problem with underemployment; the case of people unable to find jobs with sufficient hours/pay to meet their needs.
A recent paper by researchers at the University of Stirling revealed that underemployment rose from 6.2% in 2008 to 9.9% in 2012. The rate hit 30% among 16 to 24 year olds.
We have also seen the rise of ‘zero hour’ contracts. Almost unheard of a few years ago, more than a million UK workers are now under these contracts. These contracts have no specified working hours – meaning that an employee is placed on permanent stand by until or unless the employer needs them. While classed as employed, the person has no wage security as they cannot guarantee their pay from one week to the next. They also receive no sick pay, leave or other basic terms and conditions.
The Resolution Foundation recently published a review of ‘Zero Hours’ contracts which found serious issues of the spike in their use:
- Those on ‘Zero Hours’ contracts earn less than half the average wage (£236 vs. £482 per week) of those on proper contracts.
- Workplaces using ‘Zero Hours’ contracts have a higher proportion of staff on low pay(within £1.25 of minimum wage) than those who do not.
- Those on ‘Zero Hours’ contracts work 10 hours a week less, on average, than those who are not (21hrs – 31hrs).
- 18% of those on ‘Zero Hours’ contracts are seeking alternative employment or more hours versus 7% of those in ordinary contracts
- ‘Zero Hours’ contracts are hitting young people the hardest, with 37% of those on such contracts aged between 16-24.
- ‘Zero Hours’ contracts are more likely to be held by those without a degree, and with a GCSE as their highest level of education.
- Non UK Nationals are 15% more likely to be employed on such a contract than UK Nationals.
Between 2008 and 2012, inflation rose 17% according to the Consumer Price Index, while incomes increased just 7% – this translates to a real terms pay cut of 10% for working people. But the Consumer Price Index measurement tracks the rising cost of an imaginary list of products and services that the poorest workers are unlikely to ever buy. The UK Essentials Index however tracks inflation of the bare essentials that would the poorest would buy – and these have risen by an eye watering 33% during the same period. This means that not only is the impact of unemployment hitting the country disproportionately, but underemployment and exploitative employment conditions are too – with the poorest being the worst affected.
Economic Recovery? For Who?
There was a piece on the Guardian this morning talking about the triple boost to the UK economy of increased factory output, house prices and car sales, and trumpeting this as a sign of economic recovery.
But what is the point of this increased GDP if it is won at the expense of people wages and livelihoods? Surely, if the inequality in the UK between rich and poor is growing, unemployment is rising, underemployment is rising and wages are falling – this is a recession. It speaks volumes for the broken economic measures of growth at play here that a real world recession for the majority, is applauded as a recovery, when all that is recovered are the profits for transnational corporations and incomes of high earners, most of whom pay little or no contributions in tax.
Get Involved
Boycott Workfare – get involved in the campaign to outlaw workfare
UKUncut – get involved in demanding proper tax contributions from those corporations benefitting from these nightmare employment schemes.
DPAC – Disabled People Against Cuts do extraordinary work highlighting the state’s assault on disabled people. Please support them


